Outcome / Problem (+)
What it helps determine
Measures how a coastline has shifted over time — due to erosion, sedimentation, or sea-level rise — giving authorities and planners the evidence needed for coastal protection and land-use decisions.
Specific evidence
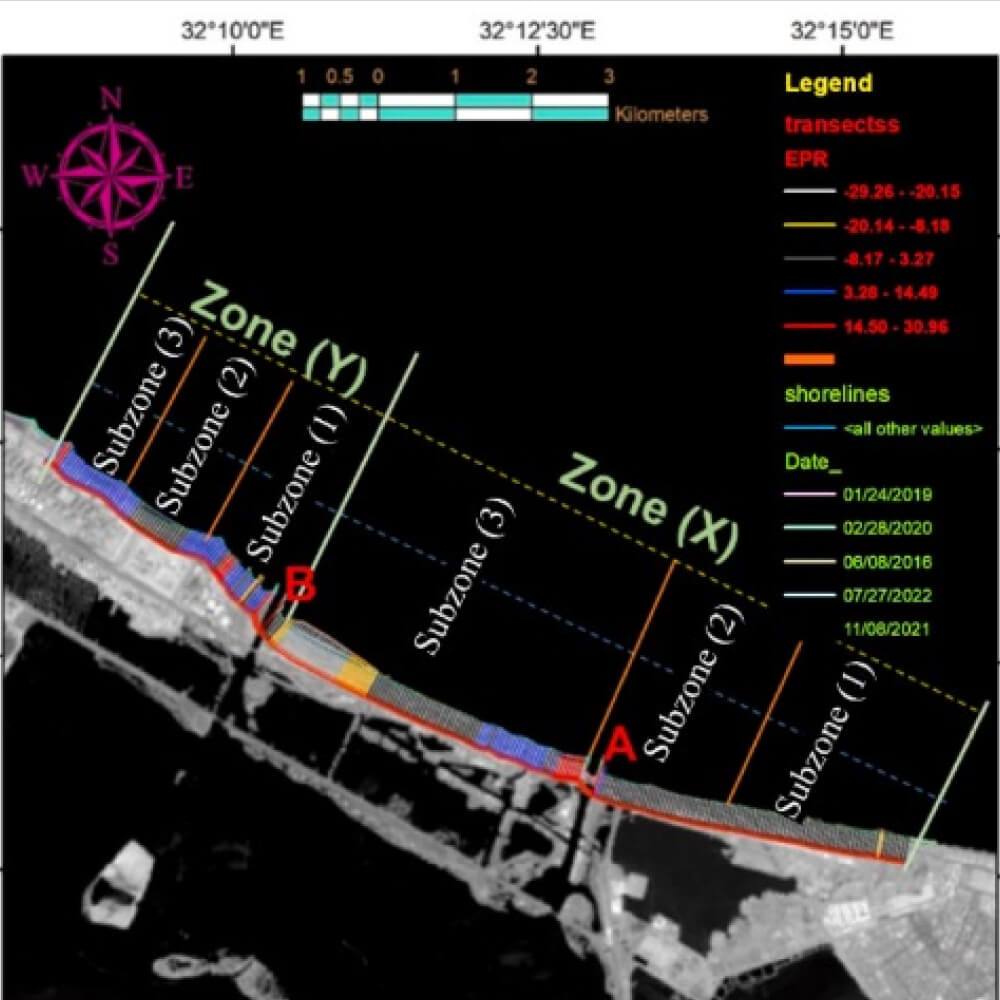
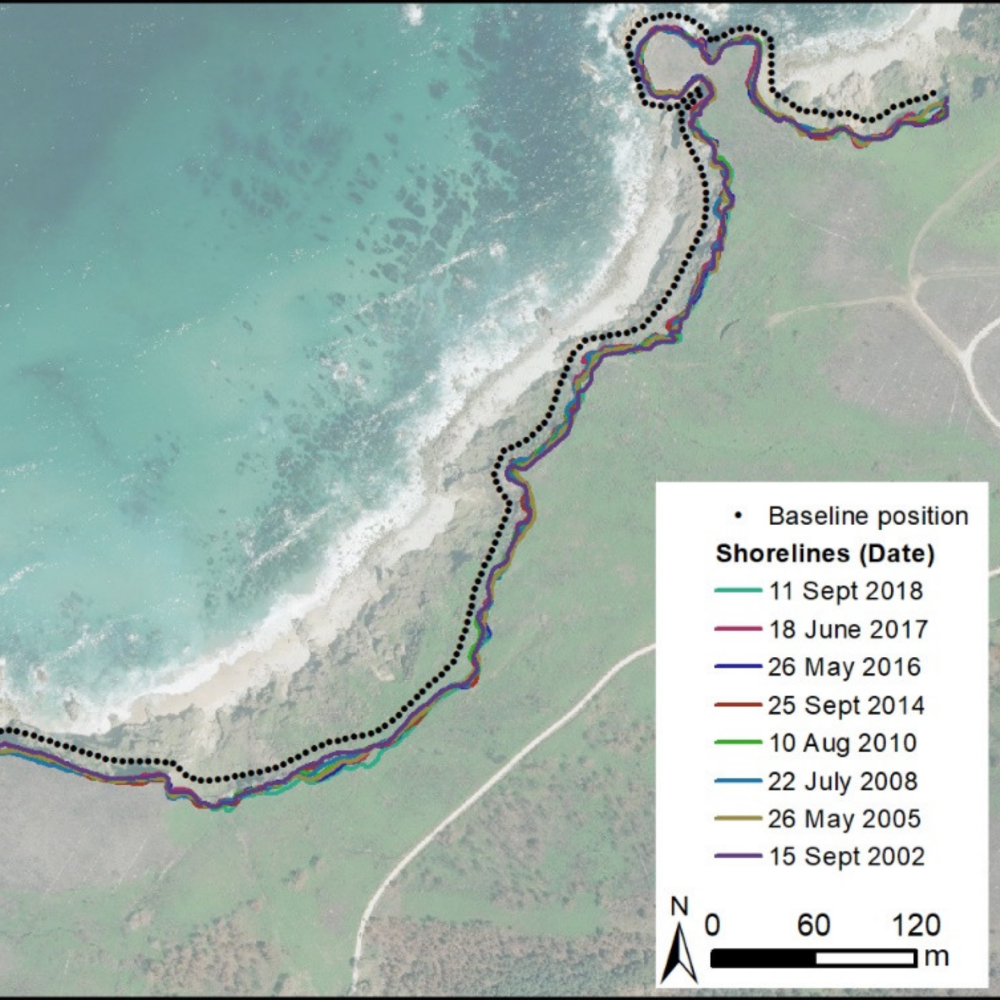
Shoreline position over multiple time periods, erosion and accretion hotspots, rate-of-change statistics (EPR, NSM, LRR), long-term shoreline movement trends.
Definition / Methodology
Core concepts
Digital Shoreline Analysis System (DSAS) is a tool that calculates shoreline change over time using historical and modern shoreline data, analysed within a GIS environment to measure erosion, sedimentation, or sea-level rise.
Technical components
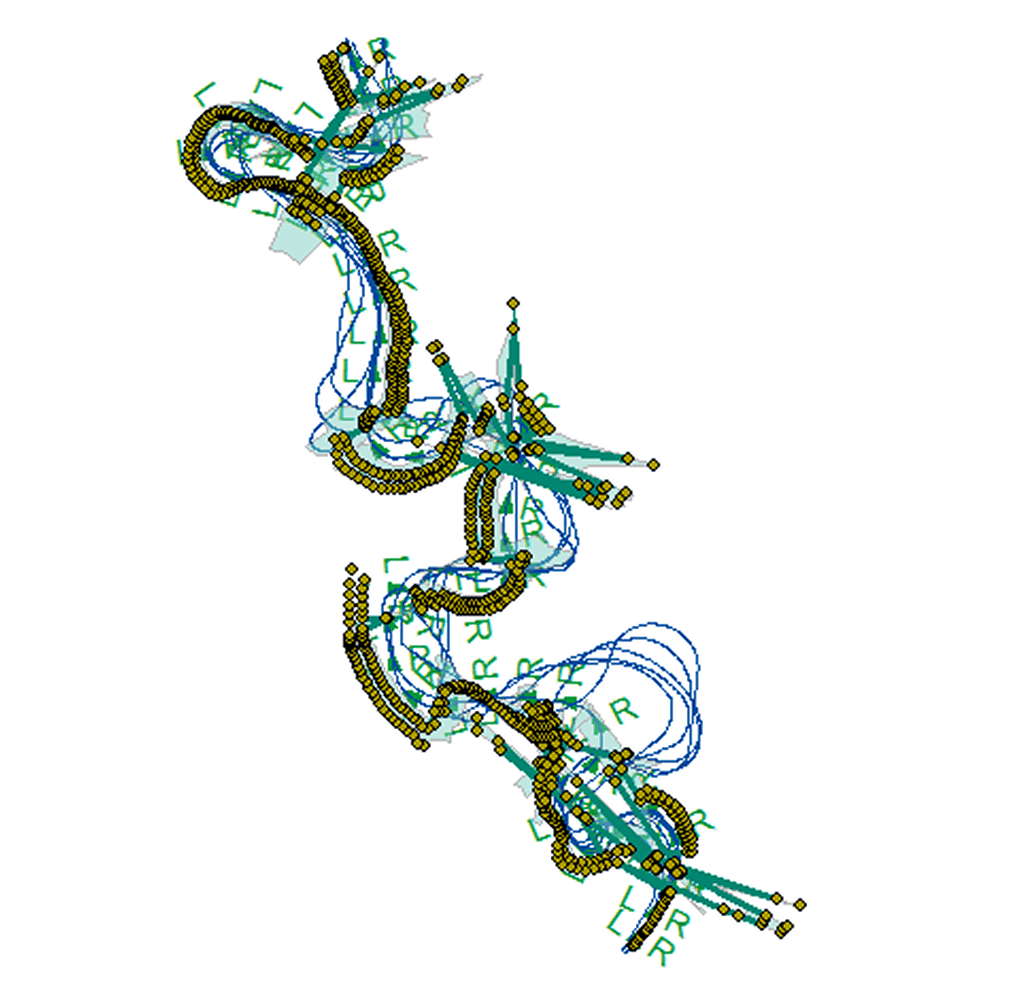
Satellite imagery, aerial photos and historical maps digitised into GIS, transects cast perpendicular to the shoreline, and statistical models (EPR, LRR) computed within the DSAS ArcGIS extension.
Applications
Where this service is used
01
Shoreline Data Collection
Gathering accurate spatial data from various sources to track shoreline positions over time.
- Digitizing Shorelines in GIS
- Geo-Referencing Historical Shoreline Data
- Satellite Imagery, Aerial Photos, or Historical Maps
02
Shoreline Change Analysis
Measuring shoreline movement to calculate erosion and accretion trends.
- Identifying Hotspots — Erosion or Deposition
- Calculating Change Statistics (EPR, NSM, LRR)
- Creating Transects (Perpendicular Lines)
03
Geospatial Mapping & Visualization
Presenting shoreline change data visually through interactive maps and models.
- GIS-Based Map Generation
- Thematic Mapping for Reports & Planning
- Visualization of Change Rates & Shoreline Positions
04
Statistical & Rate Computation
- Calculating End Point Rate (EPR)
- Linear Regression Rate (LRR) Analysis
- Standard Deviation & Confidence Interval Estimation
05
Coastal Risk Assessment & Reporting
Using DSAS output to evaluate risks for planning and development decisions.
- Identifying Erosion-Prone Zones
- Generating Coastal Vulnerability Reports
- Providing Shoreline Management Recommendations
06
Coastal Planning & Engineering
- Input for Shoreline Protection Design
- Coastal Setback Planning & Zoning Support
- Supporting Environmental Impact Assessments (EIA)
Process
How the assessment is carried out
01
Historical Data Collection
Gather satellite imagery, aerial photos, and historical maps spanning multiple time periods.
02
Shoreline Digitisation
Digitise and geo-reference shoreline positions in GIS for each time period.
03
Transect & Rate Analysis
Cast transects and compute change statistics (EPR, NSM, LRR) within DSAS.
04
Reporting & Recommendations
Deliver a coastal vulnerability report with shoreline management recommendations.
Equipment & Technology Capabilities / Methods
What we use in the field
Outputs / Deliverables
What you receive
Shoreline change rate statistics (EPR, LRR)
Erosion / accretion hotspot map
Coastal vulnerability report
GIS-ready shoreline dataset
Shoreline management recommendations
Malaysian Context
Why this matters here
Local condition
Malaysia's coastlines face erosion, sedimentation and sea-level rise pressure, intensified by climate change and coastal development.
Implication
DSAS gives authorities and planners science-based evidence of shoreline movement rates, supporting coastal protection design, setback planning and EIA submissions.
Integration / Related Services
Often paired with
LiDAR
Coastal elevation profiling from airborne LiDAR feeds shoreline change detection.
Aerial Photogrammetry
Historical aerial imagery is a core data source for shoreline change analysis.
Slope Hazard Assessment
Coastal erosion can destabilise adjacent slopes, requiring combined analysis.
Case Study
Case study coming soon
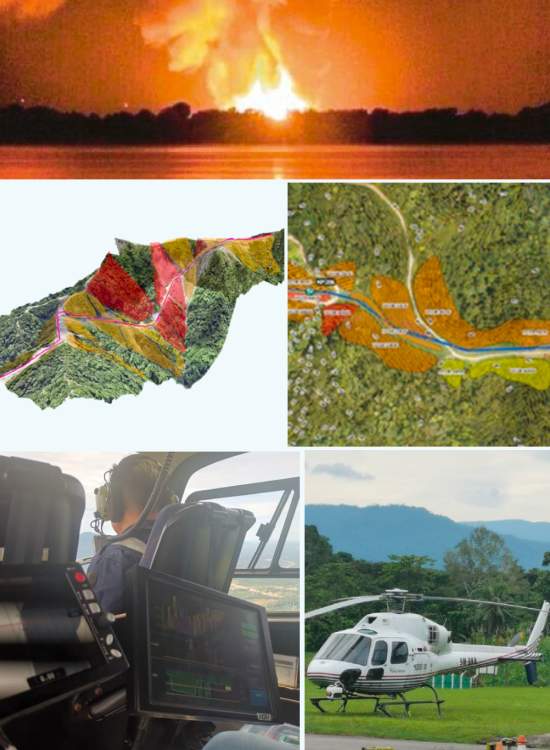
2022 · JKR Terengganu / GoGEO Engineering
Challenge
Assess terrain and hazard risk along a remote, largely inaccessible pipeline right-of-way spanning difficult tropical terrain.
Approach
Airborne LiDAR survey flown along the full corridor length, combined with terrain and hazard classification.
Finding
Identified multiple high-risk terrain segments requiring closer geotechnical follow-up.
Outcome
Delivered risk-informed terrain data to guide maintenance and monitoring prioritisation along the corridor.
Standards / Compliance
DSAS analysis follows the USGS Digital Shoreline Analysis System methodology, run as an ArcGIS extension, with outputs supporting Malaysian coastal EIA and shoreline management planning requirements.
Standards / Compliance
Proof points
01
High-End Equipment — combining DSAS tools with remote sensing and GIS expertise for 100% accuracy of data & statistics.
02
National-Level Project Experience — since 2020, we've handled 20+ state and national-level geospatial and geotechnical projects.
03
Certified Engineers & Surveyors — our engineers & surveyors are international and local graduates with extensive geo-engineering experience.
04
Custom Report & GIS Integration — you'll receive 100% accurate reporting documents with GIS integration where needed.
FAQ
Frequently asked questions
What is DSAS?
DSAS is a GIS tool that tracks and analyzes shoreline changes over time using geospatial data.
What does DSAS measure?
It calculates erosion, accretion, and shoreline movement rates using historical and current shoreline positions.
Why is DSAS important in Malaysia?
It helps monitor coastal erosion and supports coastal planning in areas affected by sea-level rise and development.
What kind of data does DSAS use?
It uses satellite imagery, aerial photos, topographic maps, and GPS shoreline data.
How accurate is DSAS analysis?
Accuracy depends on the quality of shoreline data and georeferencing; when done properly, it’s highly reliable.
Who uses DSAS?
Coastal engineers, planners, environmental consultants, and government agencies for shoreline management.
Can DSAS help predict future erosion?
Yes, by analyzing long-term trends, DSAS helps forecast future shoreline movement for better risk planning.
Is DSAS a standalone software?
No, it works as an extension within ArcGIS to process and visualize shoreline data.
How often should shoreline analysis be done?
Regular updates (every 5–10 years) are ideal, or after major coastal changes or storms.
Why choose Geotechnica for DSAS services?
We combine DSAS tools with local expertise, remote sensing, and field data for precise shoreline change assessments in Malaysia.
gallery
Project photography